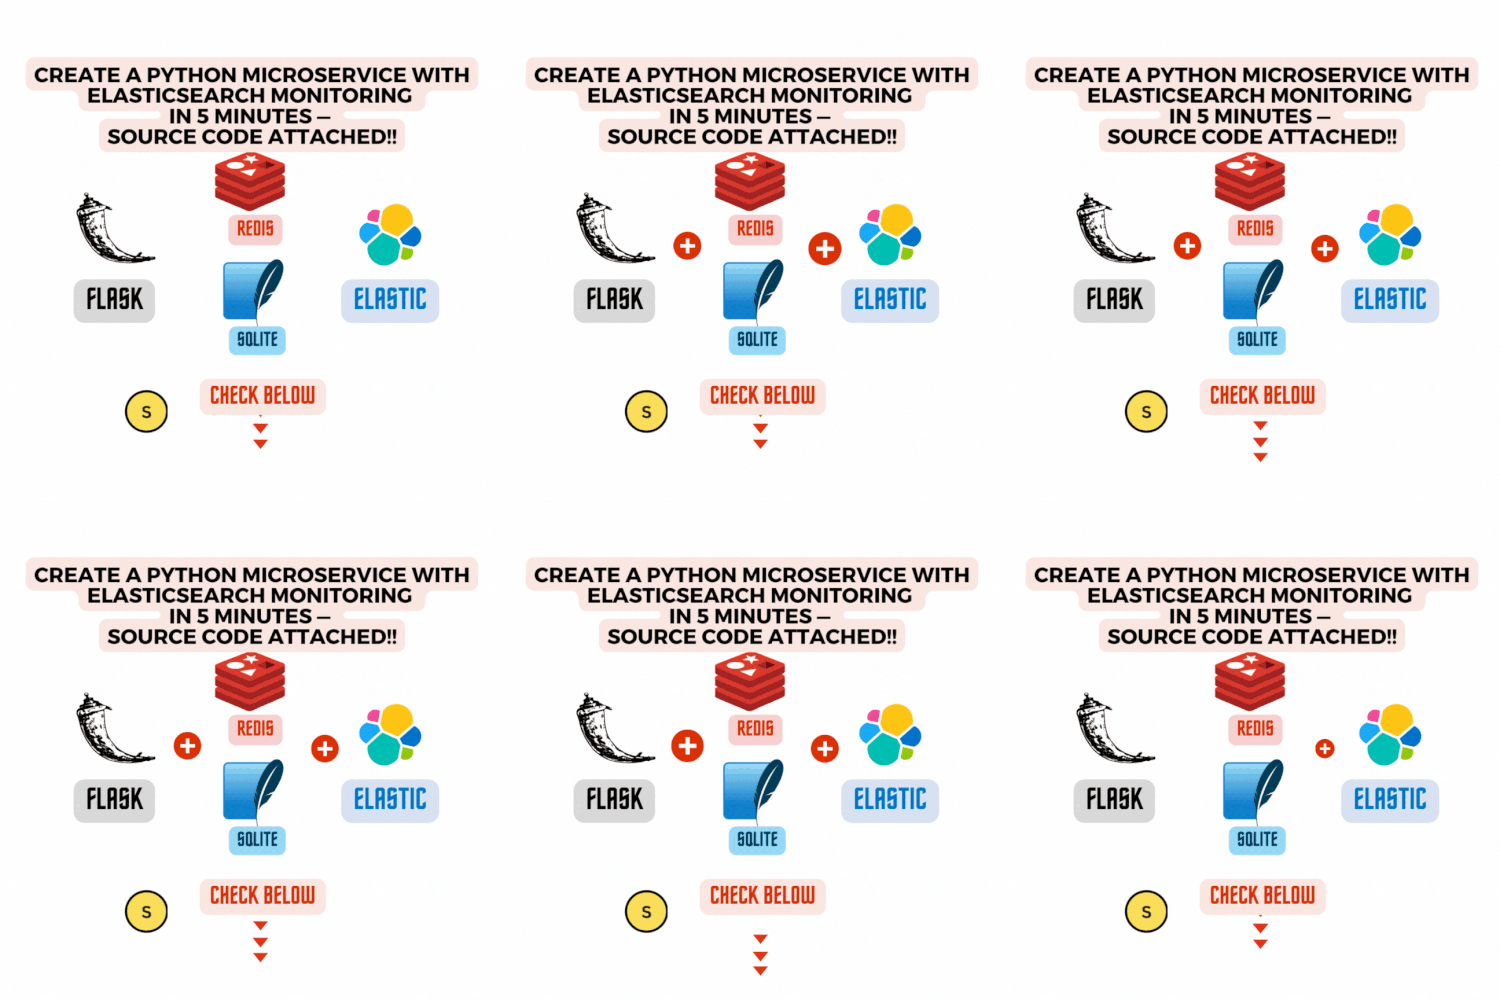
The tone of this article is to educate how the small services interact with each other in a low-level and how the monolithic infrastructure is broken down to the Microservices environment and how it can be monitored.
Let us quickly create a simple Flask API with logging messages to SQLite3 and Redis simultaneously. And, we’ll use Elasticsearch to monitor the application and the transaction logs.
# Prerequisites for Beginners using Python:
Flask, Redis, and SQLite3, you can run the below command:pip install flask sqlite3 redis
Elastic APM agent using pip:pip install "elastic-apm[flask]" psutil*Additional Documentation -> ElasticAPM agent
# What is Redis? Why we use Redis and SQL?
Redis is an open-source, in-memory data structure store that is used as a database, cache, and message broker. Redis is a popular choice for a wide range of applications because of its speed, flexibility, scalability, and ease of use.
Redis and SQL are two different types of databases that are used for different purposes. While SQL databases, such as MySQL and PostgreSQL, are used to store structured data in a relational manner, Redis is an in-memory data store that supports a wide variety of data structures.
That being said, SQL databases are the preferred choice for many applications that require structured, relational data storage and complex querying capabilities. Redis is often used in conjunction with SQL databases, with Redis being used for quick access to frequently used data and SQL being used for more persistent storage.
# Why Chose Elastic APM or Observability Solution for Monitoring?
Elastic APM (Application Performance Monitoring) is a feature of the Elastic Stack that allows users to monitor the performance and behavior of their applications in real-time. It provides a simple and intuitive user interface that diagnose performance issues. It can be used to identify and resolve bottlenecks, reduce downtime, and improve the overall user experience. It is very easy to setup compared to other Monitoring solutions.
NOTE: It is not mandatory to configure a monitoring setup for simple applications but it provides additional insights of how an application and users are interacting with the network. So, using monitoring here is to understand the basics of how application and API works.Once all the
prerequisites are met, you can directly copy-paste the below code snippet.
For more reading, check the complete Medium article here.


 Never miss a story from us, get weekly updates in your inbox.